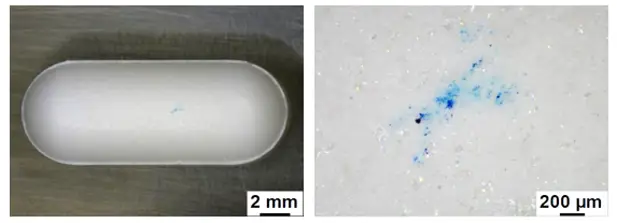
In the pharmaceutical industry, contamination can pose significant risks, affecting product safety, efficacy and quality. Rapid and accurate identification of contaminants is crucial for determining whether these issues stem from manufacturing processes and for addressing them before they cause wider problems.
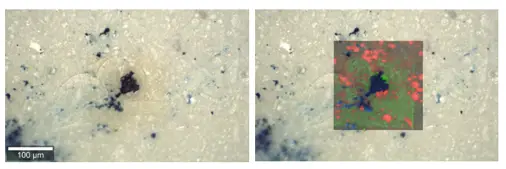
One advanced tool for this purpose is vibrational spectroscopy, a group of analytical techniques that provide molecular-level information on how materials vibrate, leading to their identification. Confocal Raman spectroscopy has emerged as a powerful and precise method for identifying contaminants, especially in cases where high spatial resolution is needed.
Confocal Raman spectroscopy offers a distinct advantage over traditional spectroscopic techniques, such as Fourier Transform Infrared (FT-IR) microspectroscopy and Scanning Electron Microscopy
with Energy Dispersive X-ray Spectroscopy (SEM-EDS). Raman spectroscopy offers a surface-sensitive approach that can distinguish even the smallest features. For example, it can identify contaminants that are embedded on the surface of tablets or adhered to the walls of containers, distinguishing the impurity from the surrounding product material.
This enhanced surface sensitivity, coupled with high spatial resolution, makes confocal Raman spectroscopy ideal for pharmaceutical contamination investigations. It can also detect photoluminescence (e.g. fluorescence), allowing for the identification of materials that may fluoresce under certain conditions.
A recent investigation into a batch of paracetamol tablets, which exhibited blue marks (Figure 1), demonstrated the effectiveness of confocal Raman spectroscopy in resolving contamination issues. In this case, traditional techniques of FT-IR and SEM-EDS were first employed to analyse the contaminants. However, these methods were not surface-sensitive enough to fully characterise the contaminant (notably, X-ray microanalysis detects sub-surface information).
Figure 1 - Micrographs of a contaminated tablet: entire tablet (left)
and the contaminated area (right).
X-ray mapping could only provide a faint indication of the presence of the largest contaminant particle, without offering a clear differentiation between the contaminant and the tablet’s material. The surface of the contaminated tablet was also investigated by FT-IR analysis following the micro-ATR[1] method. However, FT-IR analysis of complex materials commonly produces a “mixed” spectrum, with spectral features of both the contaminant and the tablet material. This created a challenge in identifying the contaminant, especially when contaminant particles were only a few micrometres in size.
Due to the diffraction-limited resolution of FT-IR, the small contaminant particles can often be masked by the spectral features of the larger tablet material, making it difficult to resolve them as discrete entities.
Confocal Raman spectroscopy overcomes the previous methods limitations by benefiting from a smaller spot size of its probing laser than that of FT-IR, high surface sensitivity, and a non-contact analysis setup. This makes it particularly effective for resolving the spectral features of small contaminant particles on complex materials.
A Raman analysis map produced at higher magnification clearly resolved a small Brilliant Blue particle, roughly 4 um in size, on the tablet’s surface.
Raman analysis also produced a detailed map of the surface (Figure 2), distinguishing between different types of spectra. These included broad photoluminescence bands (in red and green) and sharper Raman peaks (in blue), with the latter corresponding to the contaminant. The contaminant's Raman spectrum matched Brilliant Blue dye, a finding that was confirmed using RSSL’s spectral database (Figure 3).
Figure 2 – (Top) Micrographs of a tablet area analysed by Raman spectroscopy (left) and the overlaid Raman/photoluminescence map from the analysis (right). (Bottom) Spectra of the colour-coded regions
of the Raman/ photoluminescence map: tablet material (red), dye contaminant (blue) and degraded tablet product (green).
This level of detail allowed our experts to not only to identify the contaminant but also to distinguish it from the surrounding material with confidence. One of the photoluminescence spectra (red spectrum) correlated with the surface morphology of the tablet, while the another matched the green spectrum, previously analysed by SEM-EDS. This indicated that the electron beam had caused some degradation in the tablet’s surface.
Figure 3 – Raman spectrum of contaminant compared with that of a library Brilliant Blue dye.
[1] Attenuated Total Reflectance (ATR) is a technique whereby a FT-IR spectrum is measured by passing the IR beam through an optically transparent crystal placed directly in contact with the region being analysed
Its superior surface sensitivity, high spatial resolution, and ability to detect photoluminescence makes it an indispensable tool in quality control and contamination investigations. As demonstrated in the case of paracetamol tablets contaminated with Brilliant Blue dye, Raman spectroscopy can pinpoint and identify even the most challenging contaminants, helping manufacturers resolve issues quickly and prevent future occurrences.
By incorporating Raman analysis into routine quality checks, companies can ensure greater accuracy in contamination detection and uphold the highest standards of product safety and quality.